Being up to date anywhere and anytime.
When it comes to managing multiple vessels in an economic viable way, fleet owners have an increasing need to access information. Reporting real-time and historical data becomes more important. With the availability of affordable data communication systems, internet access is an attractive way to distribute data from a ship to land. This opens a wide array of opportunities for optimizing administrative tasks, automating ship's logs, data mining and real-time information.
Acquiring Data
Wizzo has developed a system which enables the communication with on-board devices like engine control systems, alarm systems, oil quality devices etc. but can also acquire any analog or digital signal with dedicated measurement hardware.
The framework of the system is set up in a flexible way and can be easily adjusted to fits our customer's needs. With this strategy any data on any vessel can be logged.
All data is temporarily stored in a local buffer. When connected to the internet, the data in the buffer will be transferred to a secure cloud location. Having a dynamic compression of the data, the system is able to store data of high speed signals such as vibrations, images or sounds.
Secure connection

Understanding the importance of the acquired data, a secure VPN connection to the cloud is established on every session. This connection does not only scrambles the data but also provides a stable transmission.
With the data encrypted, the information of the vessel is hidden from the competition. Transferring data to the cloud can be performed by any type of internet connection.

Dashboard in the Cloud
A dashboard with relevant data presents the acquired data from one vessel or the complete fleet. The dashboard operates as a web application and can be displayed on any computer (Windows, Linux or Mac) with internet access and runs in a standard web browser.
Presentation
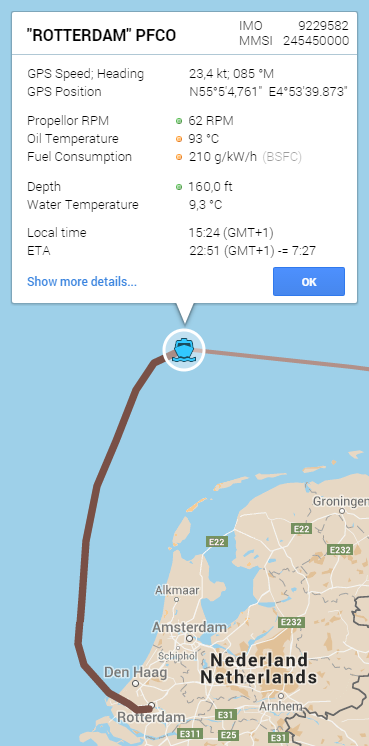
In the web application the data can be displayed in countless ways. Basic lists can provide key information or present (real-time) alarm levels.
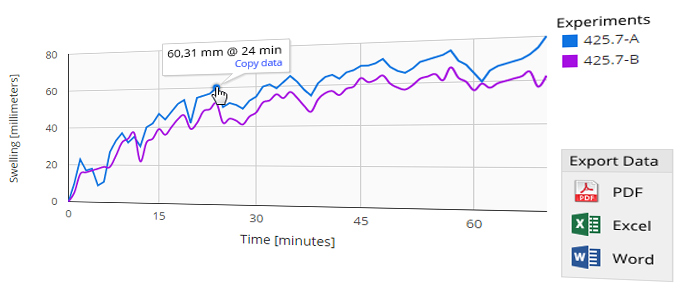
In easy to use graphs, the data displayed, provides a complete historical overview. The graph is one of the most powerful tools the application offers. Allowing multiple plots to be displayed in one graph, acquired signals can be related to time or to other data sources, giving insides in complex relations.
Advanced triggers and alarm levels can be used to pinpoint events in time. Making complex analysis easy with just one click.
Views
Everyone has his/her own interests in the collected data from the vessels. In the web application so-called views can easily be created by any user, allowing the presentation of the desired data.
More information?
Wizzo IT Solutions
De Trompet 2222
1967DC Heemskerk
The Netherlands
